#qgis

21 posts · Last used 10d

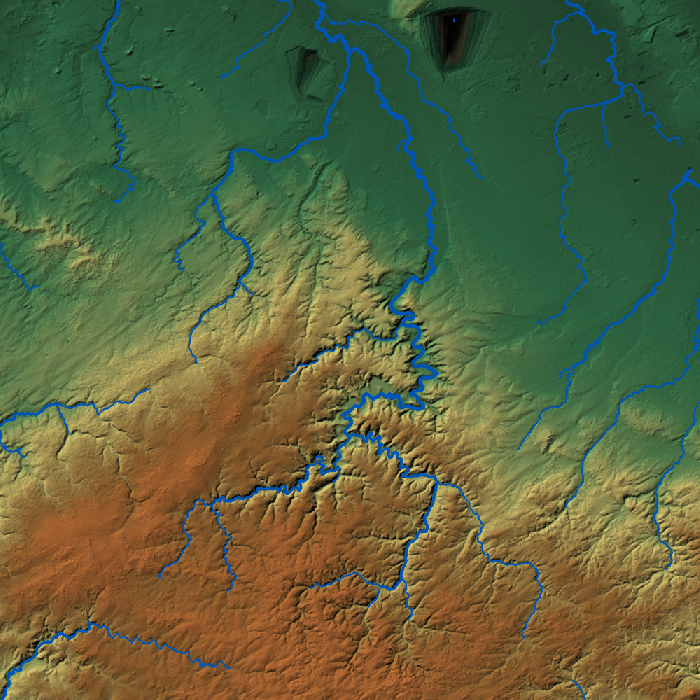
⚠️ Why standard GIS routing (D8, Sink Fill) fails in complex mining regions: 300m open pits become fake "lakes", and underground river tunnels are completely ignored. To map surface drainage across central Kryvyi Rih, I built a custom DEM hydro-conditioning pipeline: 🔹 Selective sink filtering (true pits vs DEM noise) 🔹 Subsurface conduit burn-in (diversion tunnels) 🔹 Closed micro-catchment delineation Crucial for geochemical transport & geotechnical risks. 🛠️ #RStats (#terra, #Rsagacmd), #QGIS, #SAGAGIS #GIS #Hydrology #HydroEnforcement #FOSSGIS #Mining #Geospatial #KryvyiRih #DigitalTerrainAnalysis
0
0
0
0
🛠 What does an end-to-end open-source stack look like for an independent hydrogeochemical monograph? Doing full-cycle research—from thermodynamic calculations to print-ready LaTeX typesetting—requires a synchronized toolkit. Here is the exact stack: 🧪 Thermodynamics & Analytics: • #PHREEQC 3.7.3 for aqueous speciation&equilibrium modeling. • #Rstats Stack: RedModRphree, ggtern, sf/terra, tidyverse (ETL). 🗺 GIS & Literature Search: • #QGIS for spatial alignment & cartography. • #Recoll for local full-text search across reference databases. 📚 Typesetting & Reproducibility: • #LaTeX2e + #TeXStudio + #JabRef for typography & #BibTeX references. • xtable for automated R-to-LaTeX data exporting. • #Debian Linux as a main engine. 💡 Takeaway: Zero proprietary software licenses needed. Complete reproducibility from raw analytical data to a print-ready PDF. 🔗 The published version of monoghraph is here: https://zenodo.org/records/20709306 #Hydrogeology #Geochemistry #LaTeX #GIS #OpenScience #DataScience #SvystunovaGully
6
4
5
0
Most of my afternoon today was spent in #QGIS with one of my Masters students Dee Patel. We're preparing my long-term bird monitoring data around Christchurch, NZ, for analysis. Today we gridded up my four standard bike transects into 1 km sections, surrounded by approximately 1 km square polygons. Dee's particularly interested in how the conversion of farmland to urban housing affects birds. Next Dee will be doing some clever analysis of my distance sampled bird counts to estimate the density of each bird species in each grid cell in each month over the past 12–23 years (depending on the route). She'll then compare those densities with land use changes from the NZ land cover database. It's going to be interesting to see what patterns emerge. #EcologicalMonitoring #birds #nz #ecology #LincolnUniversityNZ
23
1
12
0
London "Geo" Meetup #5 is coming up! We’re excited to share that we now have a venue for the #August #meetup: Birkbeck College, University of London 📅 12th August 🕕 6:00 PM onwards 📍 Birkbeck, London This time, we’re also organizing a #QGIS #workshop as part of the #meetup — a great way to welcome #newcomers and get hands-on with #geospatial tools. We’re still looking for #speakers for the #event, so if you have a #geo story, #project, or #idea to share, we’d love to hear from you.
1
2
0
0
I have a #GIS question, or maybe it's a #dataScience question: I want to represent geographical information to non-technical people, ideally via the web, showing how data about people, organizations, places relate to each other, on a map. The data is both private data sets - starting with CSV - and also publicly available. I have some familiarity with #QGIS, but not the data side of it. I could build something there, and then export to KML, and I know there are also javascript-based web export methods. Or I could build it in Google Maps, or some other online platform. I'd like for the people I share this with to be able to interact with the data and the map. In a perfect world, I'd make what I did for my location (USA state, or region) available to others in my organization, people who are likely not GIS savvy, so they could replicate it for their region. What would you do?
0
0
3
0
a coworker asked me how to style a basemap vector tile (you know one of the kind of issues they were developed...). I could not figure how to do that with their access to arcgis pro (agol is supposed to works easily, no idea). It was one copy paste, 3 clicks in #QGIS and very transparent. One day govt sector will wake up and rise!!! #gischat
6
1
5
0
Replying to
Here's an animated movie of the accumulating korimako observations over the past 18 years along my fortnightly 10.1 km run route in Ōtautahi-Christchurch, NZ. https://flic.kr/p/2soCFTA #wildcounts #EcologicalMonitoring #birds #Christchurch #Ōtautahi #NZ #Flickr #animation #map #qgis #bellbird
10
0
3
0