Is there an utility application (or maybe a plugin for a DAW) that analyses a midi file and gives statistical data with graphs and histograms and stuff on which notes are used, how often, and when that shifts over the course of the file etc?
It could be a really useful aid for music analysis. My specific use case would be deciding on bespoke microtunings for a specific piece.
If any music/code/data visualisation nerds want to write such a program I'd love to collaborate on design and function. But maybe something like this already exists?
I think it would be fairly easy on the coding side, but there might be some design challenges.
#linuxmusic #midi #musictheory #microtuning #datavisualisation

#datavisualisation
3 posts · Last used 19d
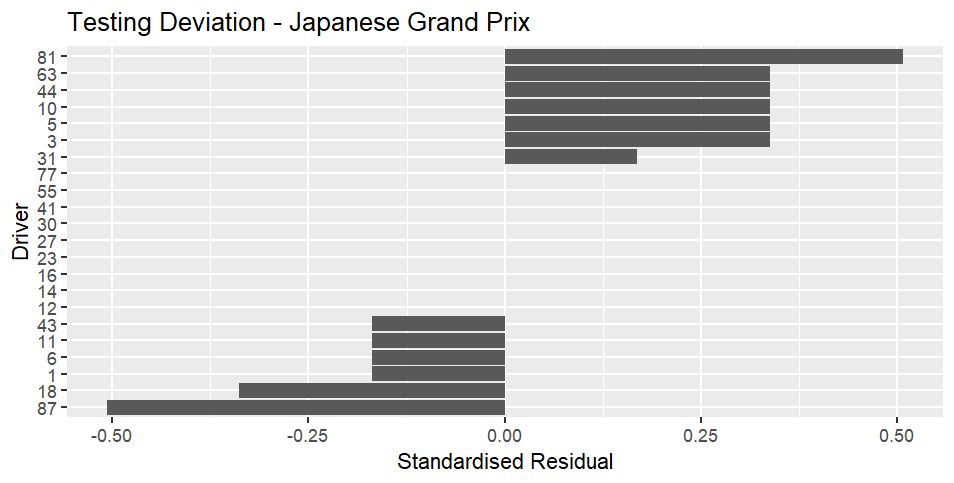
Are the scrutineers picking on my driver? - Update after the Japanese Grand Prix - https://fulltimesportsfan.wordpress.com/2026/05/05/are-the-scrutineers-picking-on-my-driver-update-after-the-japanese-grand-prix/ In which patterns continue to emerge, and some of my theories gain evidence.
#Formula1 #JapaneseGP #rstats #datavisualisation
Boosted by @kkarhan@jorts.horse
The Guardian and Full Fact have published an article looking at some of the more suspect bar charts used by candidates in the upcoming English local elections. It draws heavily on our database of election leaflets: https://electionleaflets.org/
https://www.theguardian.com/politics/2026/apr/26/voters-contend-with-grotesque-leaflets-and-dodgy-data-in-english-local-elections-say-analysts
#datavisualisation
You've seen all posts